
Haida Tribe
2024 · Tablet Interface · Complex Content & UX Strategy · Iconography · UI Design · Figma
Digital Heritage & Marriage Management Dashboard
Overview
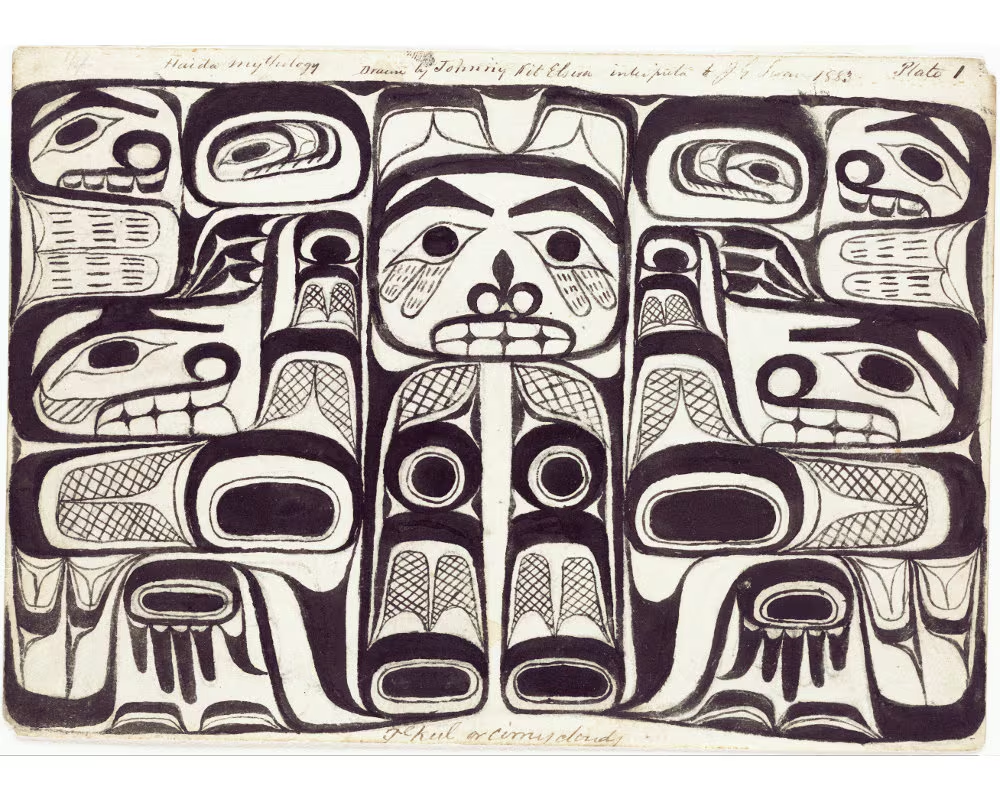
"The challenge was to translate the complex ancestral laws of the Haida tribe- from moiety structures (Raven vs. Eagle) to resource management into a structured iPad interface.
By transforming oral traditions into a modern Information Architecture, we created a digital tool that ensures cultural preservation and efficient community governance."

Loading


UX Strategy & Information Architecture
To digitize the Haida heritage, we first had to decode it. We mapped a comprehensive information tree that translates complex social moities, resource rights, and ancestral laws into a functional digital hierarchy. This strategic phase ensured that every data point in the final UI serves a specific cultural and operational purpose.
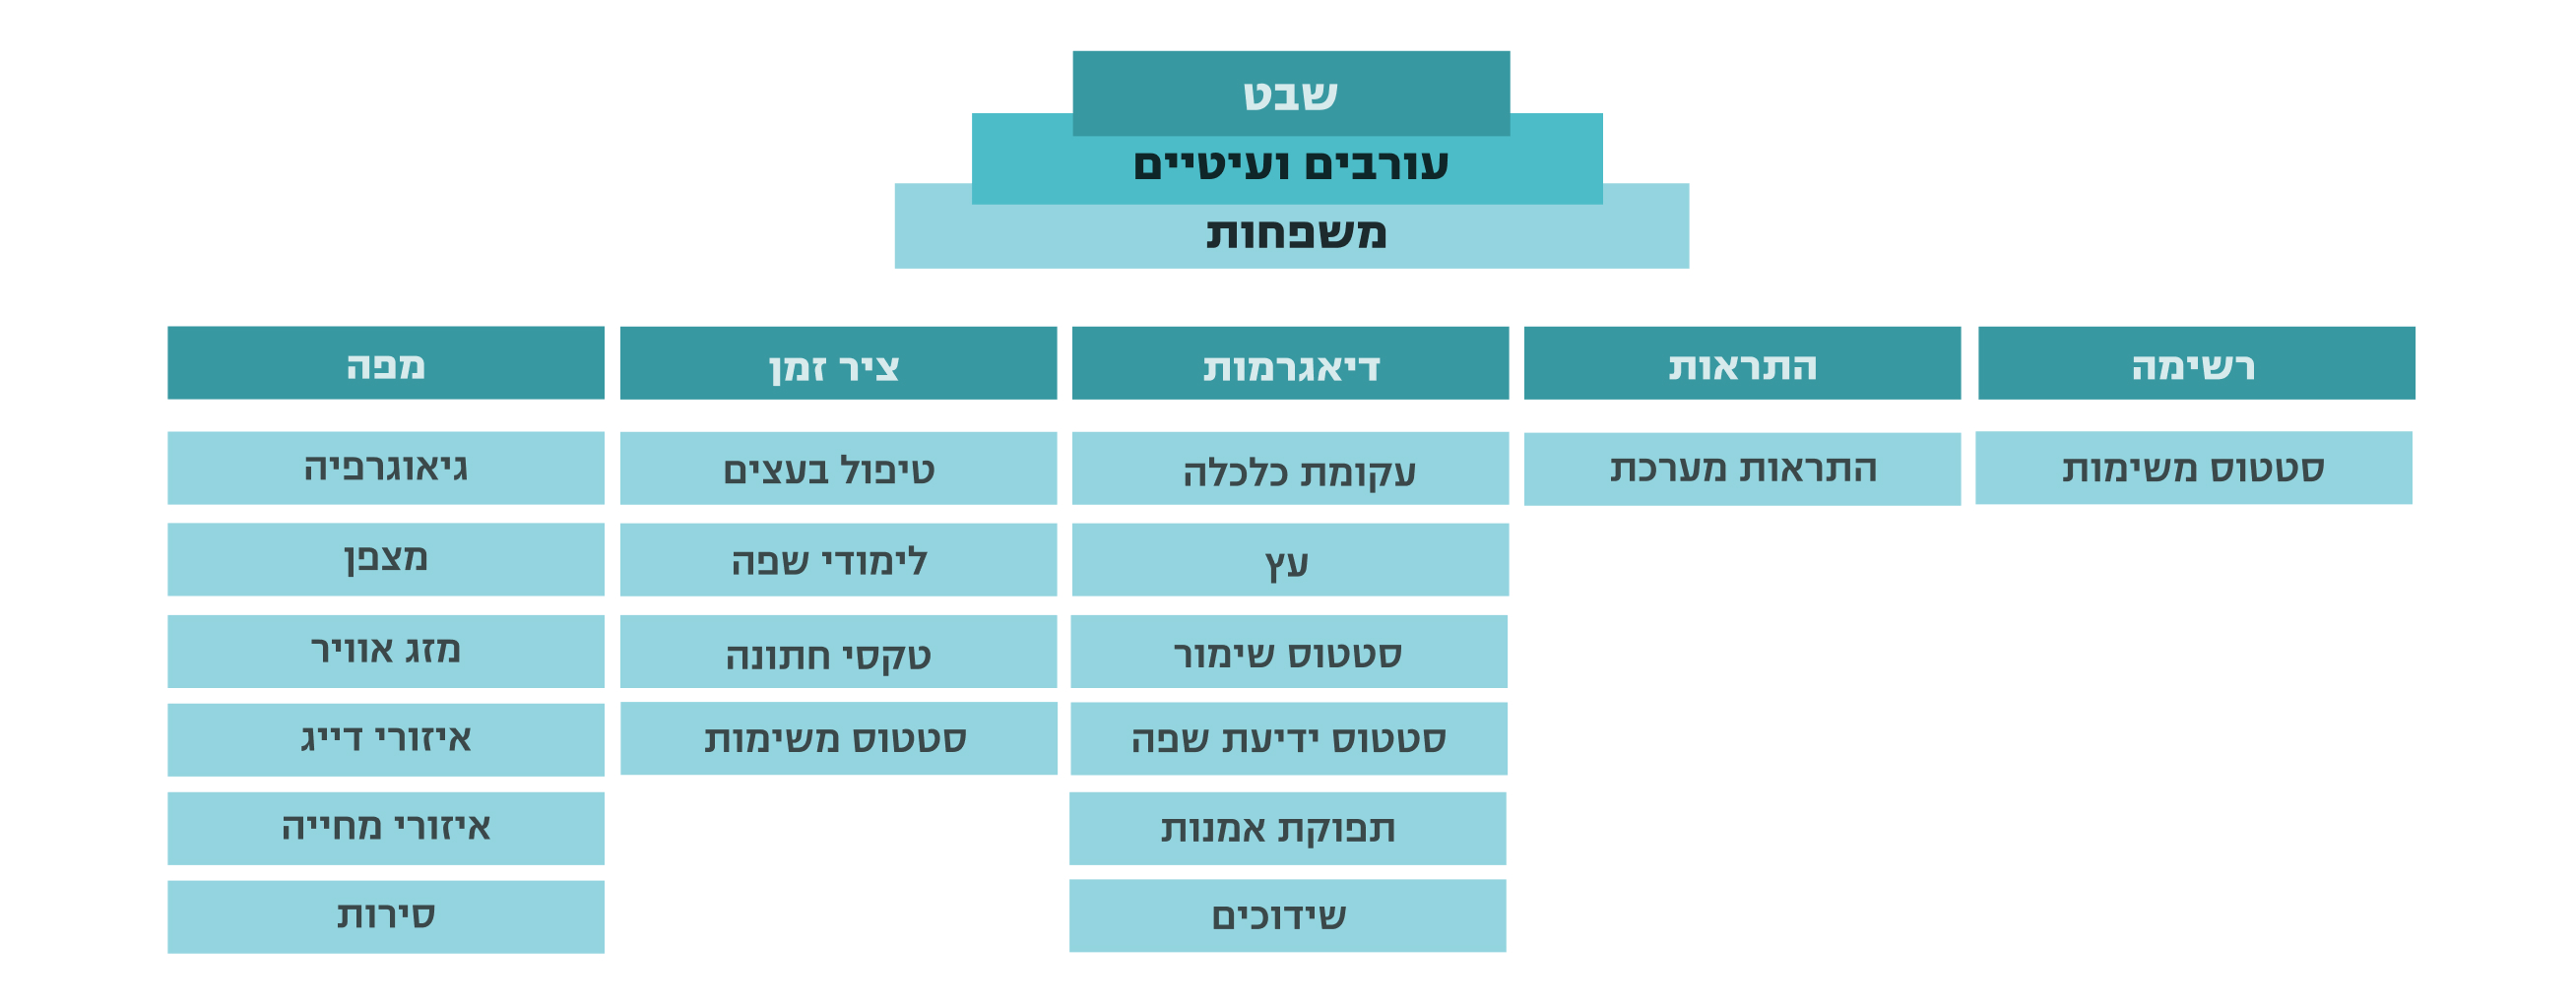
Mapping the core tribal structure—from moieties to specific family resources—to build a scalable digital database.
Operational Role Mapping
Analyzing community occupations: from master artisans to maritime navigators—to define specific user tasks and system permissions. This ensured the interface supports the actual day-to-day needs of the tribe.
Interface
Architecture
Translating the structural logic of the tribe into functional UI components. By mapping features like resource charts, marriage registries, and status alerts, we ensured the system remains intuitive despite its high data density.
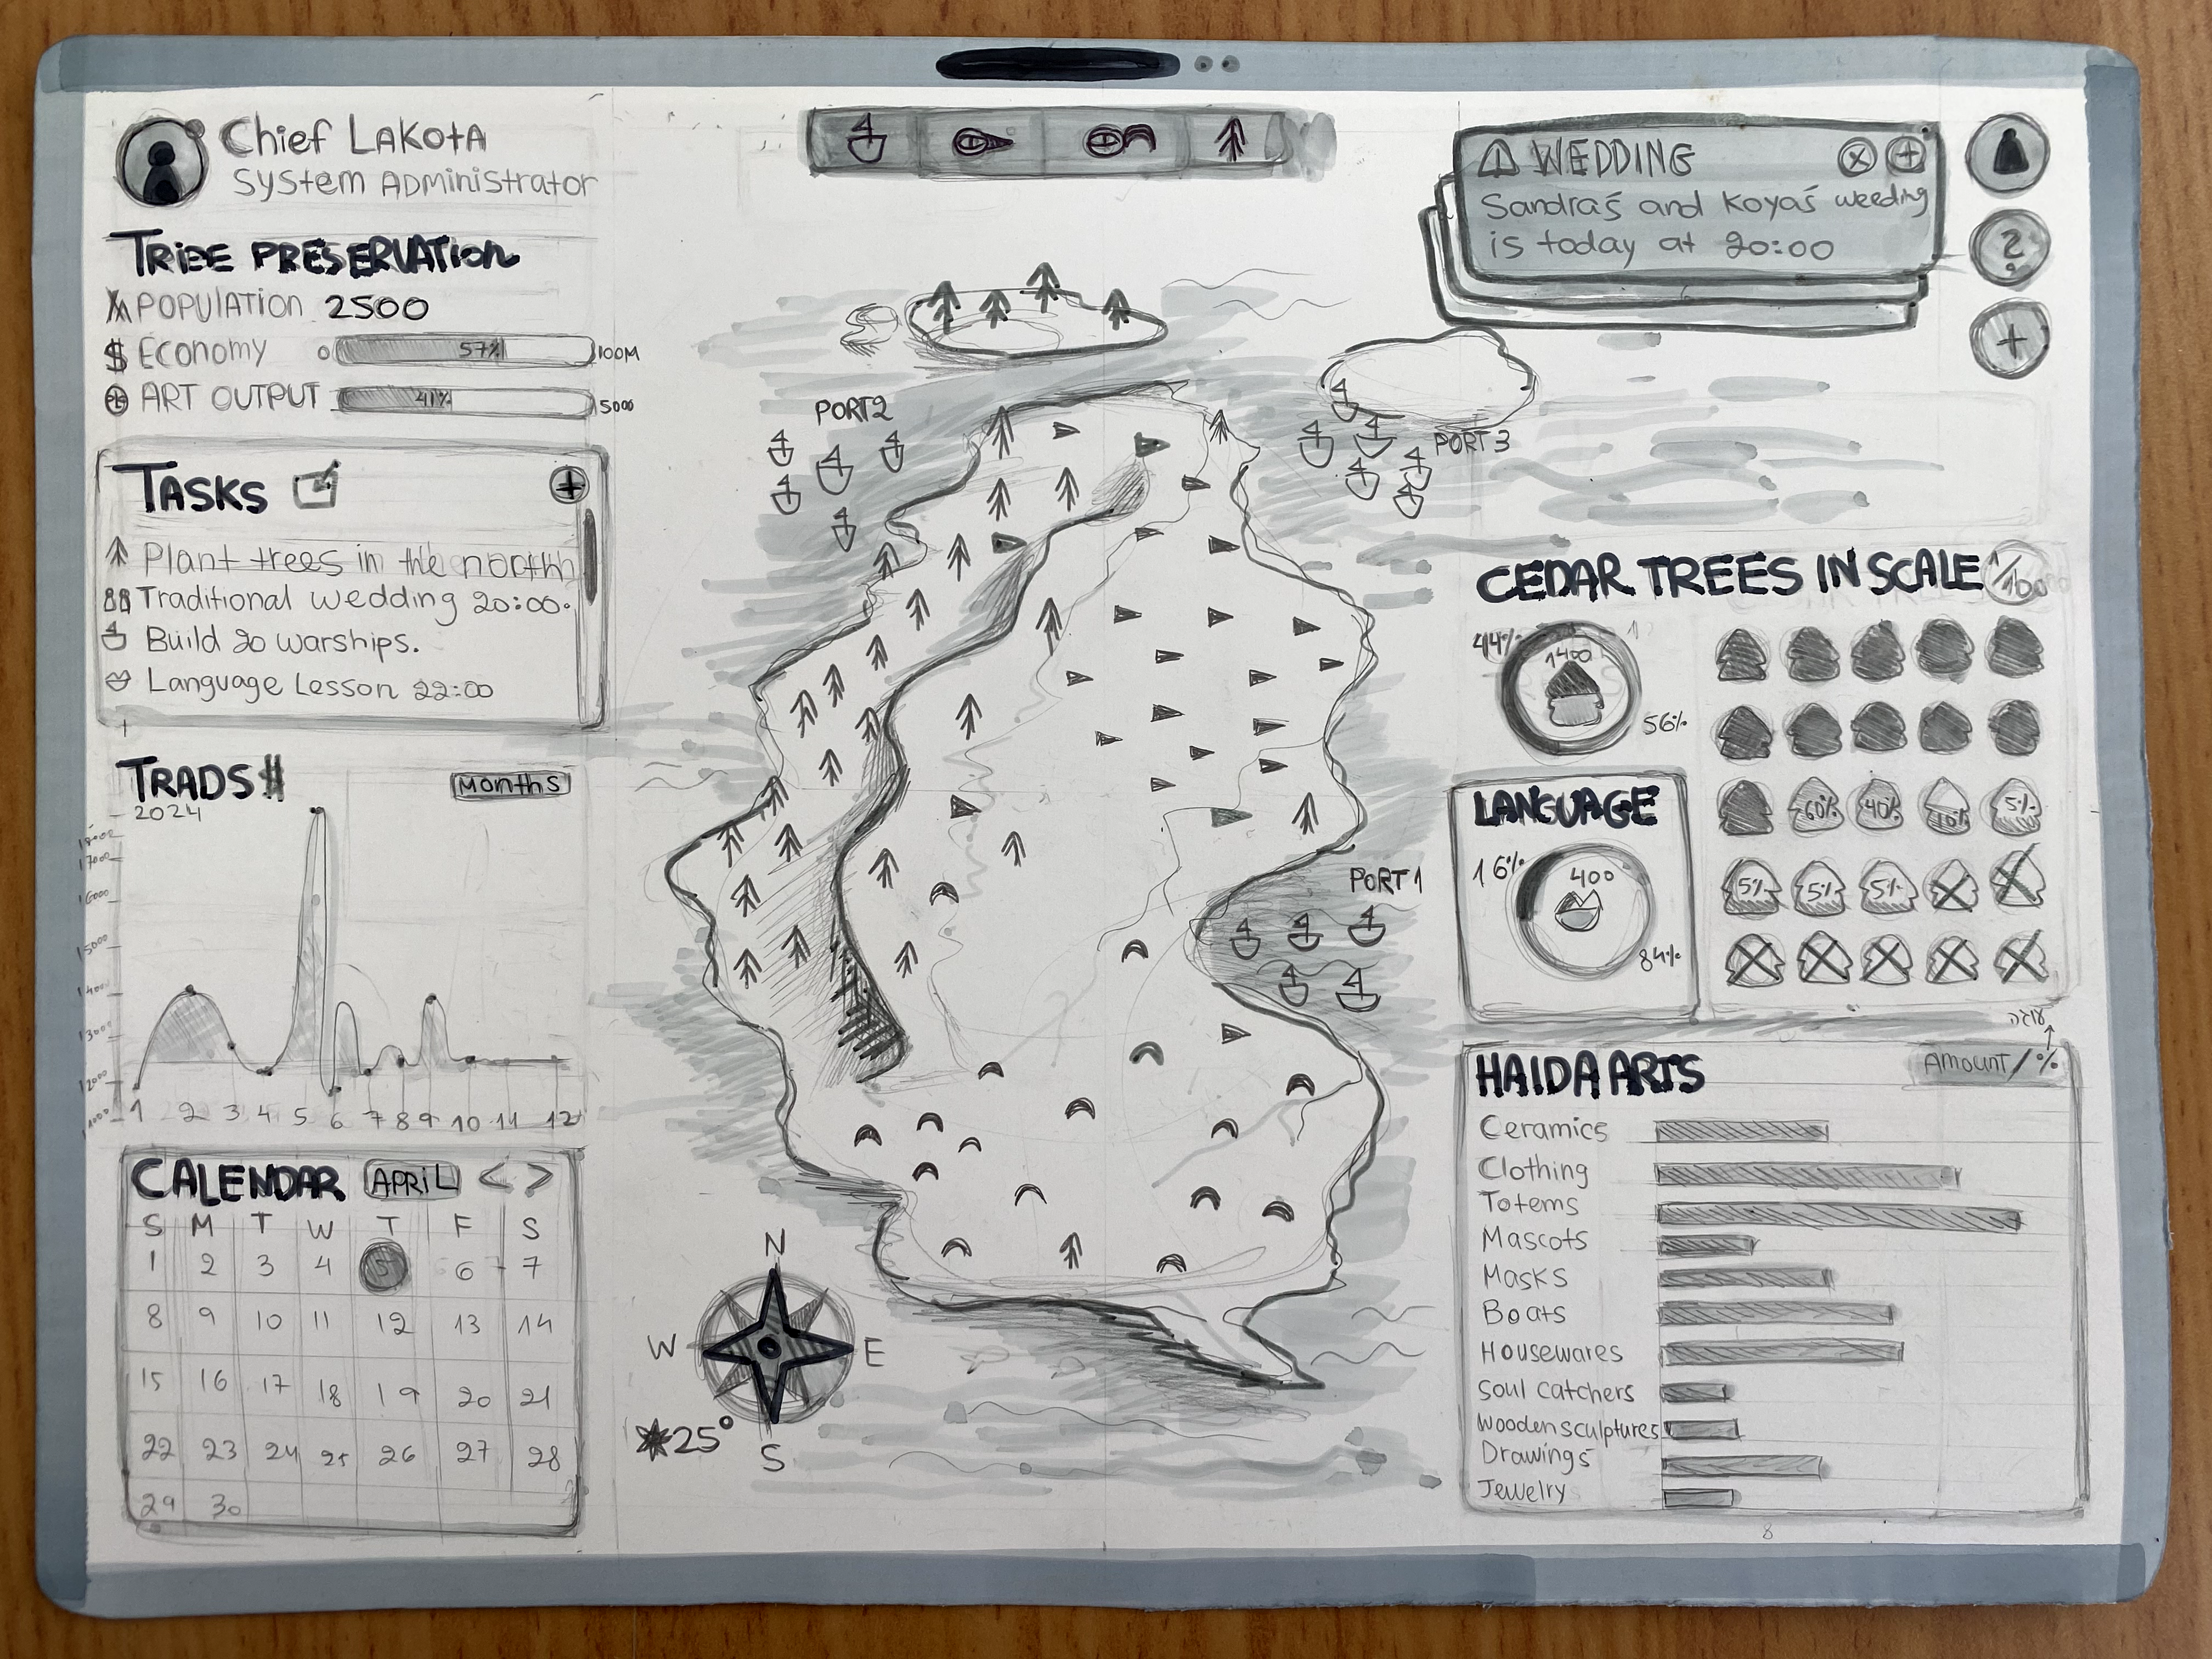
Ideation & Sketching
Wireframes
Early sketches and low-fidelity wireframes used to iterate on the complex dashboard layout, focusing on data hierarchy and ease of use for tablet devices.
Mood board
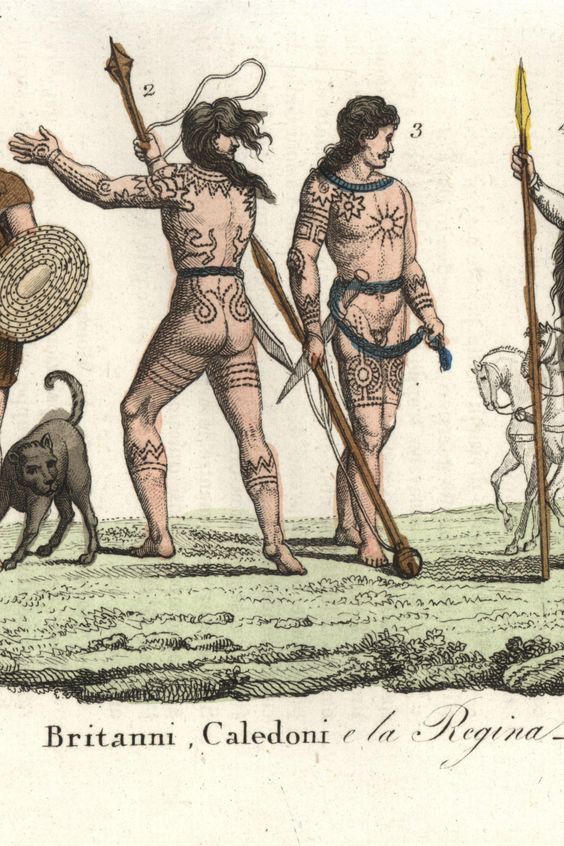
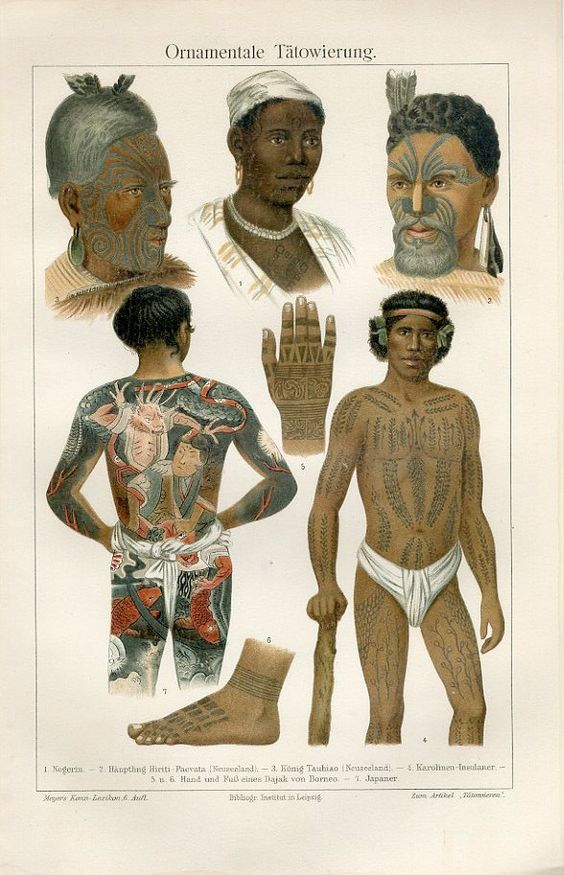

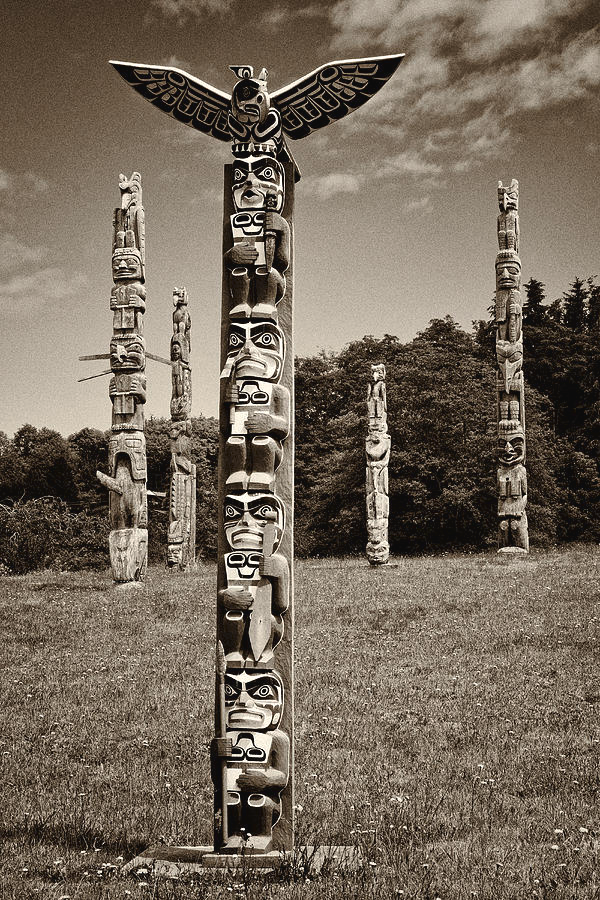
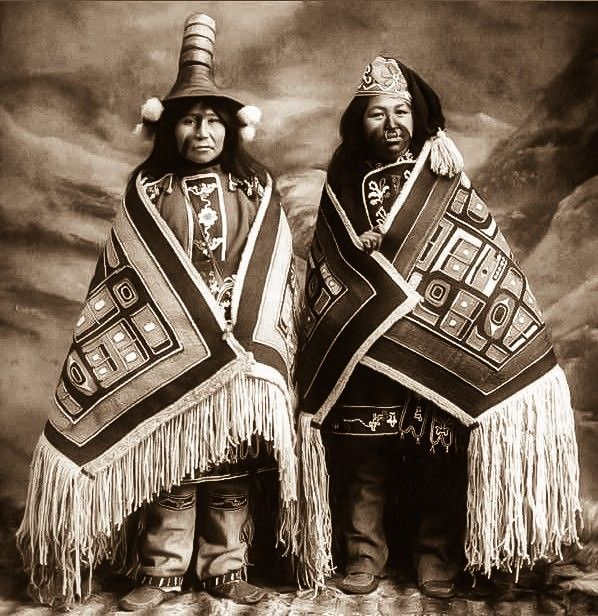
Cultural Visual Language
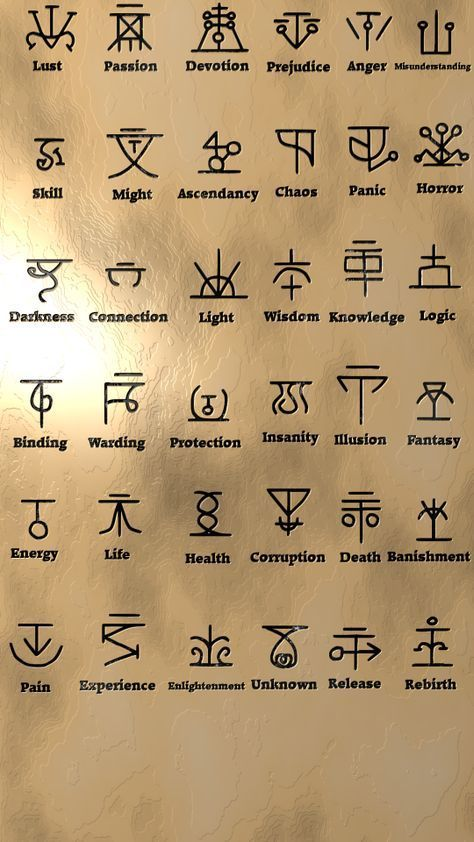
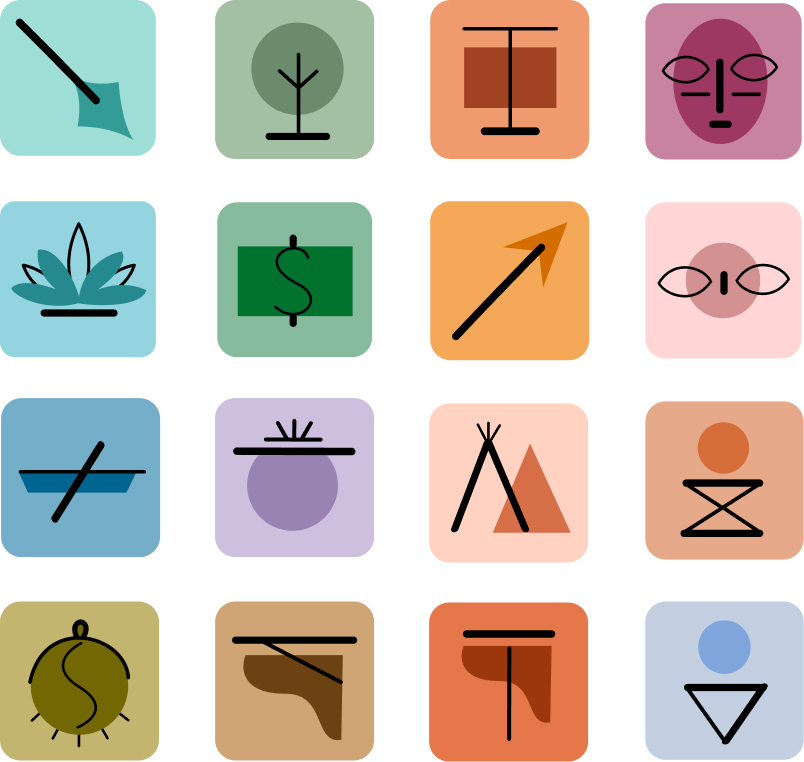
Iconography
To maintain cultural authenticity, I designed a custom set of 30+ icons and graphic motifs inspired by Haida art. These elements serve as the primary navigation system, ensuring the interface feels native to the tribe’s heritage.
Skills & Occupations
The color palette is inspired by high-visibility safety indicators. Each 'scenario' is assigned a distinct primary color to create immediate visual separation between different household zones.
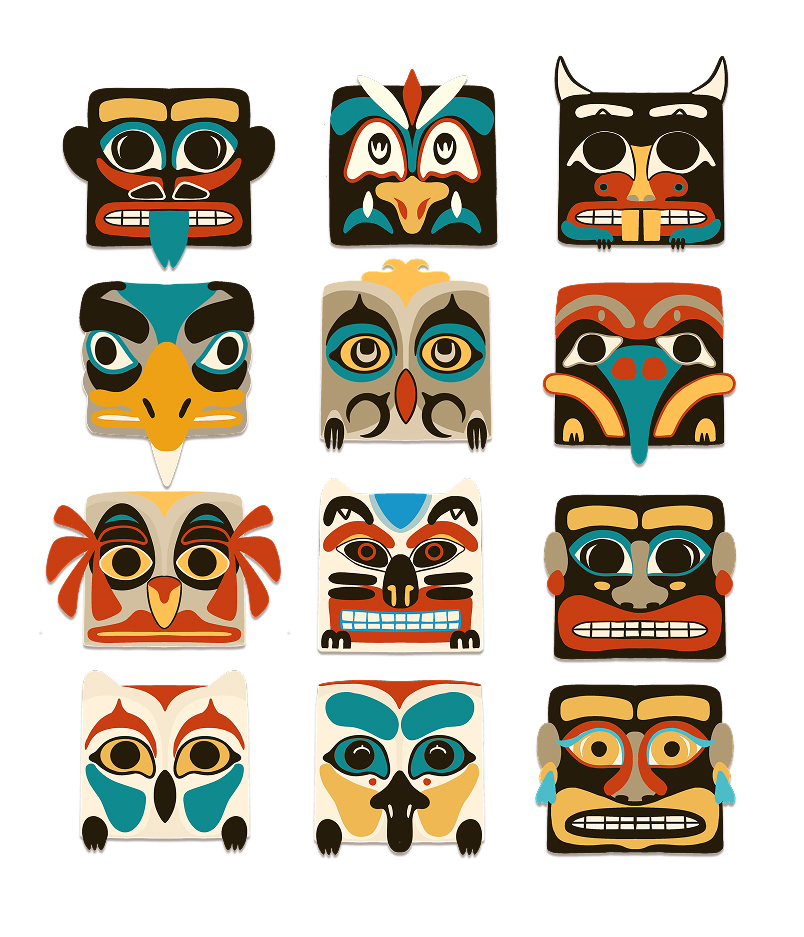
Ancestral Totem Identity
The color palette is inspired by high-visibility safety indicators. Each 'scenario' is assigned a distinct primary color to create immediate visual separation between different household zones.
Interface & Cartography
The color palette is inspired by high-visibility safety indicators. Each 'scenario' is assigned a distinct primary color to create immediate visual separation between different household zones.
Design System & UI
A modular design system built to handle high-density data while maintaining a clean, accessible interface.
The Final UI
These interfaces allow both tribal leaders and families to monitor cultural preservation, manage resources, and track ancestral lineages in real-time, ensuring the tribe's legacy thrives in the digital age.
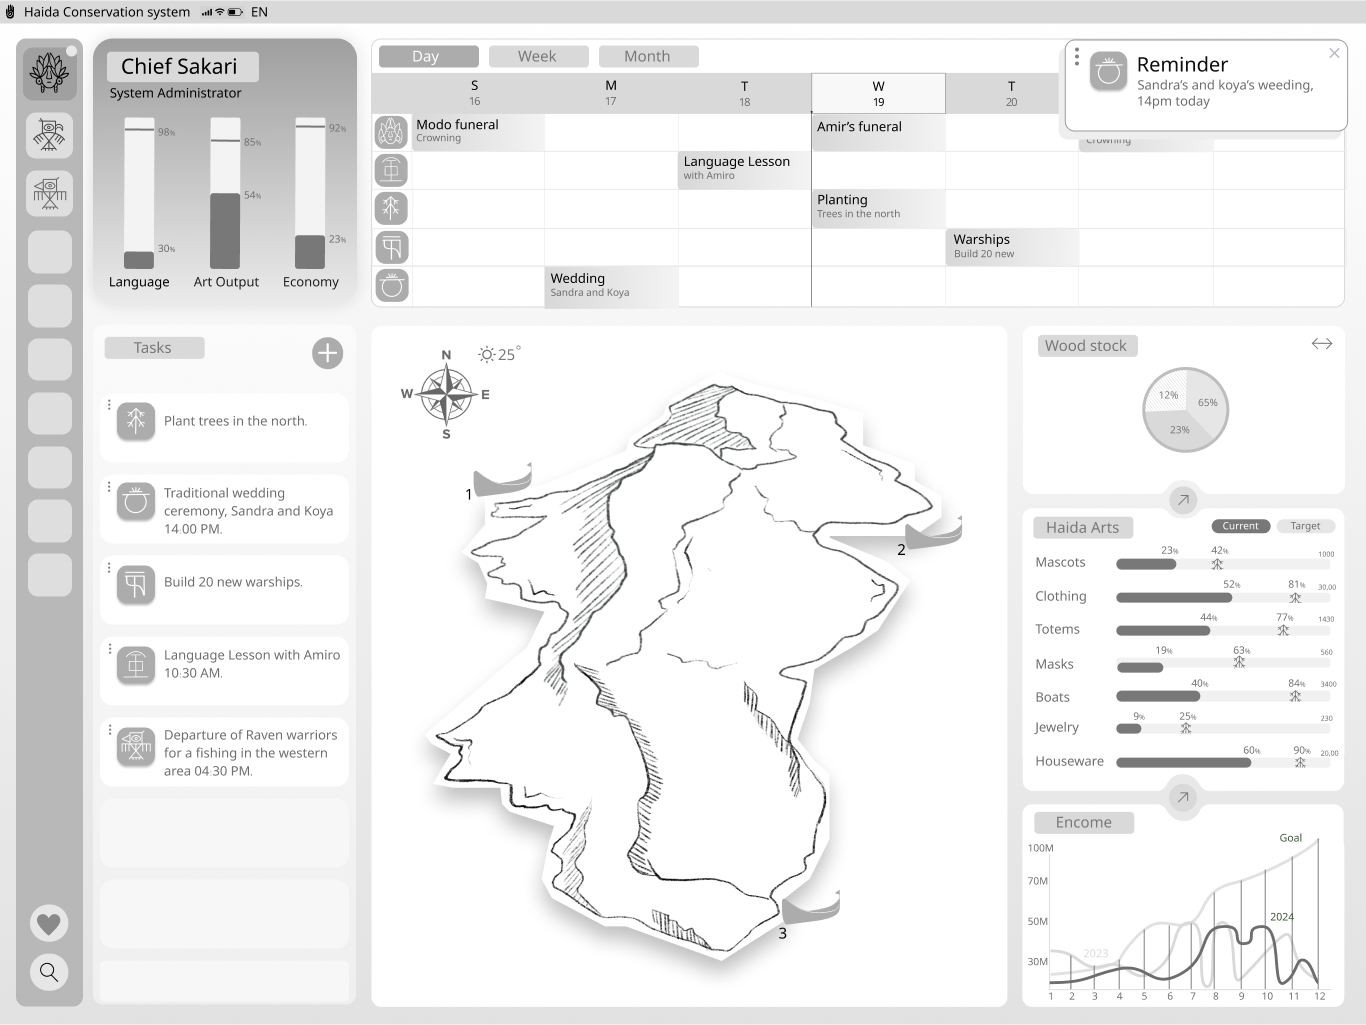
Leadership Command Center
The first line of communication—a lighthearted, digital nudge sent directly to their chat for an instant, humorous reminder.
Family Dashboard
A localized view for families to manage daily tasks and territory. This dashboard acts as a gateway to the Dynasty Index, emphasizing how individual family growth contributes to the tribe’s collective future and social continuity.
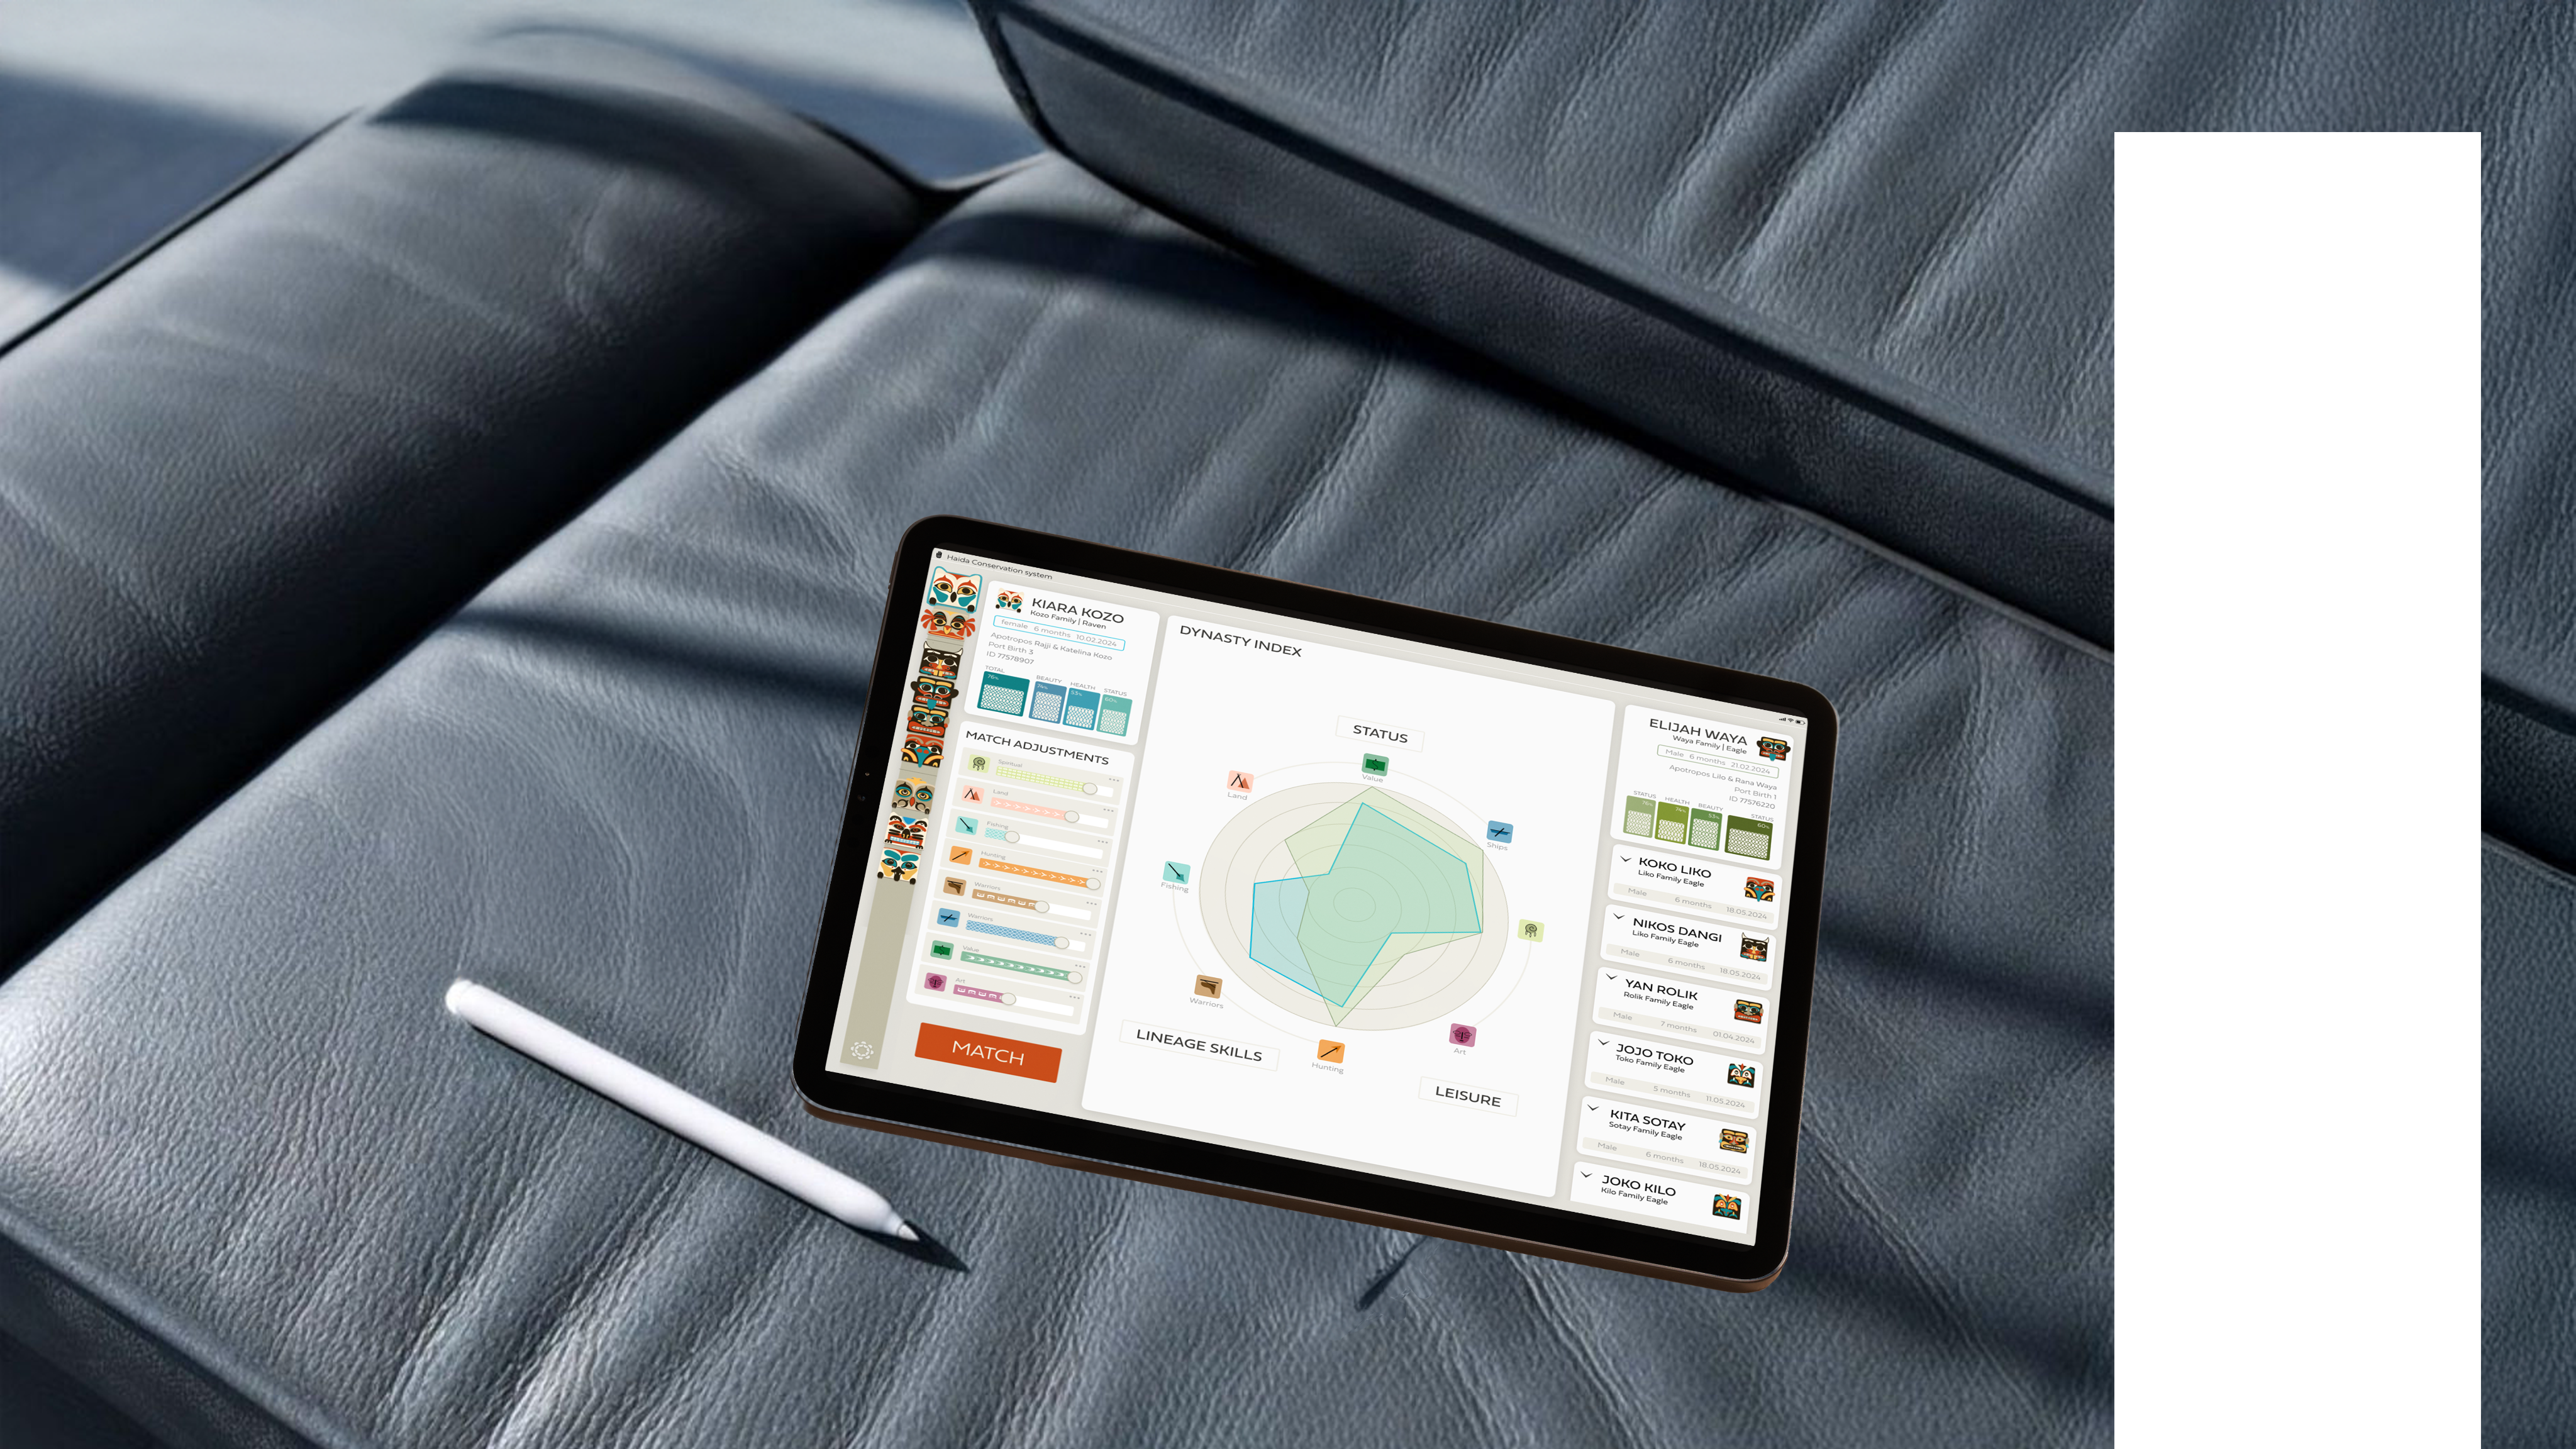
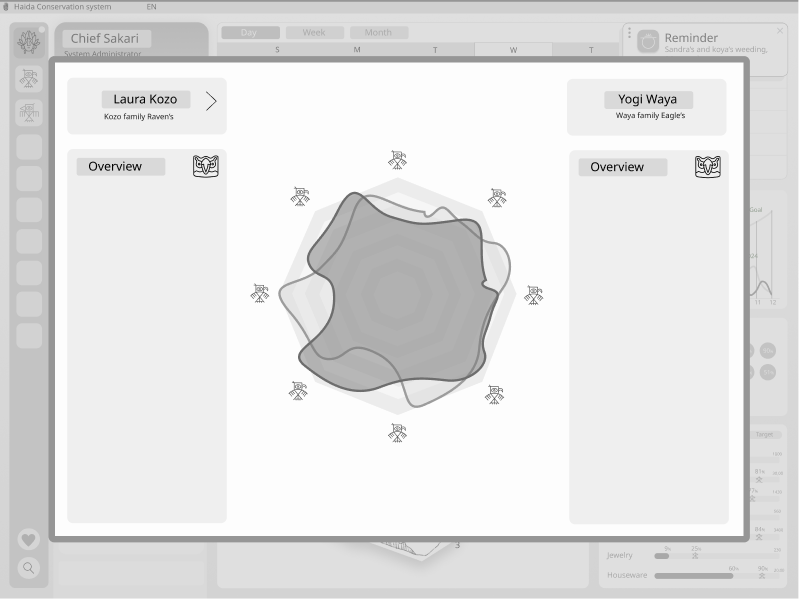
Ancestral Matchmaking
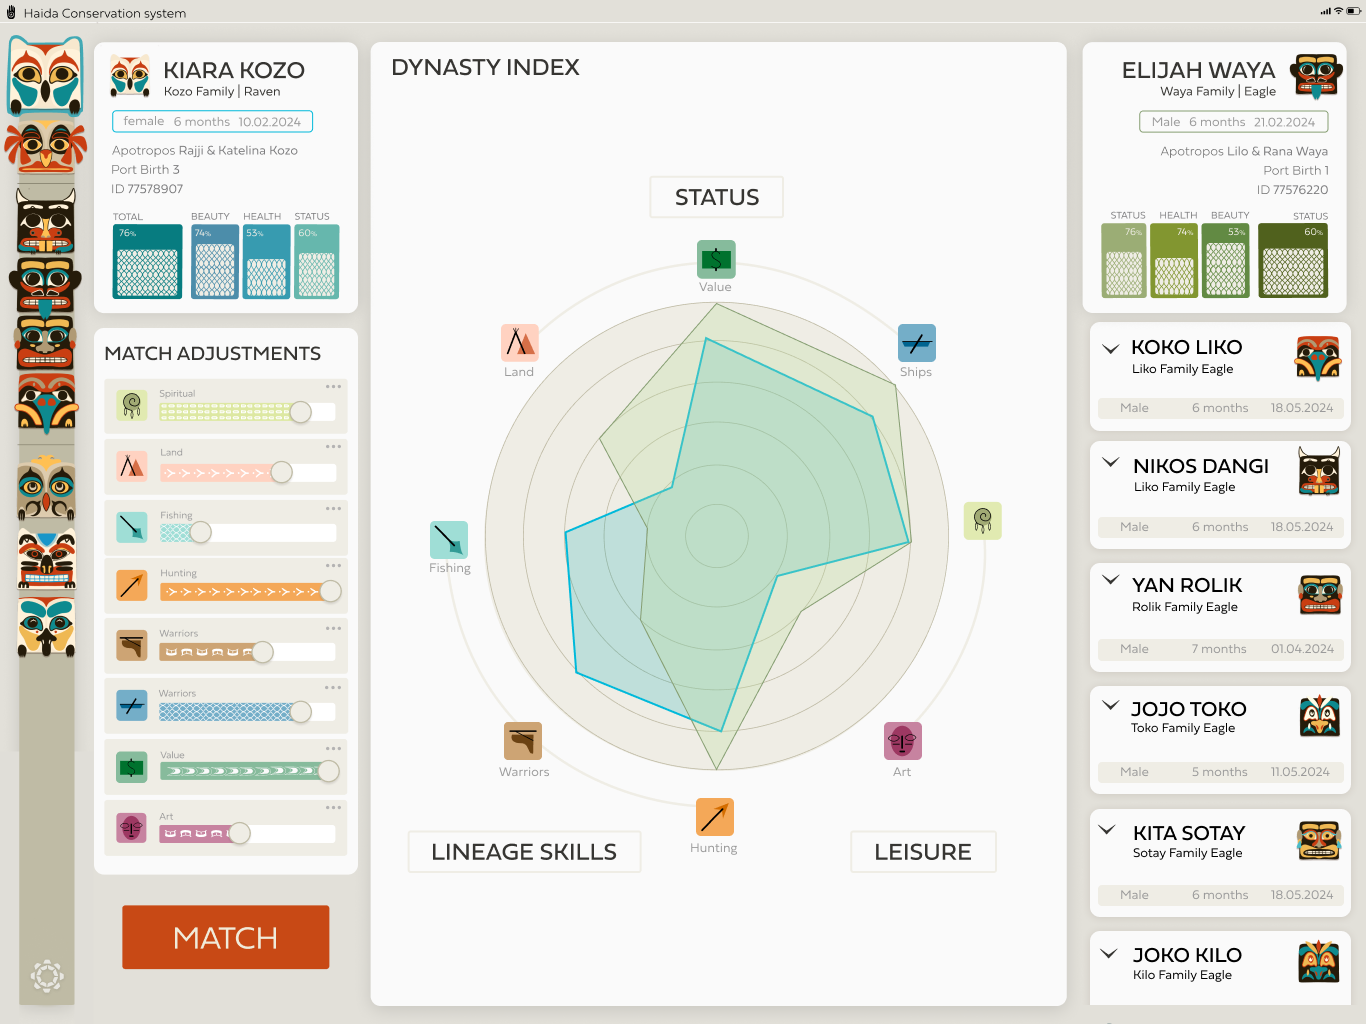
The heart of the system. Using a specialized spider chart, this interface compares candidates based on lineage skills and moiety laws. It facilitates strategic connections essential for maintaining the tribe's social fabric.
ronniebenhaim@gmail.com
Designed & built by me

Haida Tribe
2024 · Tablet Interface · Complex Content & UX Strategy · Iconography · UI Design · Figma
Digital Heritage & Marriage Management Dashboard
Overview
"The challenge was to translate the complex ancestral laws of the Haida tribe- from moiety structures (Raven vs. Eagle) to resource management into a structured iPad interface.
By transforming oral traditions into a modern Information Architecture, we created a digital tool that ensures cultural preservation and efficient community governance."
Loading

UX Strategy & Information Architecture
To digitize the Haida heritage, we first had to decode it. We mapped a comprehensive information tree that translates complex social moities, resource rights, and ancestral laws into a functional digital hierarchy. This strategic phase ensured that every data point in the final UI serves a specific cultural and operational purpose.
Mapping the core tribal structure—from moieties to specific family resources—to build a scalable digital database.
Operational Role Mapping
Analyzing community occupations: from master artisans to maritime navigators—to define specific user tasks and system permissions. This ensured the interface supports the actual day-to-day needs of the tribe.
Interface Architecture
Translating the structural logic of the tribe into functional UI components. By mapping features like resource charts, marriage registries, and status alerts, we ensured the system remains intuitive despite its high data density.
Ideation & Sketching
Wireframes
Early sketches and low-fidelity wireframes used to iterate on the complex dashboard layout, focusing on data hierarchy and ease of use for tablet devices.
WhatsApp Quick-Send
Email Formal-Nudge
Mood board
Cultural Visual Language
Iconography
To maintain cultural authenticity, I designed a custom set of 30+ icons and graphic motifs inspired by Haida art. These elements serve as the primary navigation system, ensuring the interface feels native to the tribe’s heritage.
Skills & Occupations
The color palette is inspired by high-visibility safety indicators. Each 'scenario' is assigned a distinct primary color to create immediate visual separation between different household zones.
Ancestral Totem Identity
The color palette is inspired by high-visibility safety indicators. Each 'scenario' is assigned a distinct primary color to create immediate visual separation between different household zones.
Interface & Cartography
The color palette is inspired by high-visibility safety indicators. Each 'scenario' is assigned a distinct primary color to create immediate visual separation between different household zones.
Design System & UI
A modular design system built to handle high-density data while maintaining a clean, accessible interface.
The Final UI
These interfaces allow both tribal leaders and families to monitor cultural preservation, manage resources, and track ancestral lineages in real-time, ensuring the tribe's legacy thrives in the digital age.
Leadership Command Center
The first line of communication—a lighthearted, digital nudge sent directly to their chat for an instant, humorous reminder.
Family Dashboard
A localized view for families to manage daily tasks and territory. This dashboard acts as a gateway to the Dynasty Index, emphasizing how individual family growth contributes to the tribe’s collective future and social continuity.
Ancestral Matchmaking
Tribal Dashboard (Admin)
The heart of the system. Using a specialized spider chart, this interface compares candidates based on lineage skills and moiety laws. It facilitates strategic connections essential for maintaining the tribe's social fabric.
ronniebenhaim@gmail.com
0542336061
Designed & built by me
Tel-Aviv, Israel

Haida Tribe
2024 · Tablet Interface · Complex Content & UX Strategy · Iconography · UI Design · Figma
Digital Heritage & Marriage Management Dashboard
Overview
The challenge was to translate the complex ancestral laws of the Haida tribe- from moiety structures (Raven vs. Eagle) to resource management into a structured iPad interface.
By transforming oral traditions into a modern Information Architecture, we created a digital tool that ensures cultural preservation and efficient community governance.
Loading

UX Strategy & Information Architecture
To digitize the Haida heritage, we first had to decode it. We mapped a comprehensive information tree that translates complex social moities, resource rights, and ancestral laws into a functional digital hierarchy. This strategic phase ensured that every data point in the final UI serves a specific cultural and operational purpose.

REC


מפה
ציר זמן
דיאגרמות
התראות
רשימה
גיאוגרפיה
לימודי שפה
טיפול בעצים
סטטוס ידיעת שפה
טקסי חתונה
עקומת כלכלה
התראות מערכת
סטטוס משימות
עץ
סטטוס שימור
מצפן
מזג אוויר
איזורי דייג
איזורי מחייה
סירות
תפוקת אמנות
שידוכים
סטטוס משימות
משפחות
שבט
עורבים ועיטיים
Mapping the core tribal structure—from moieties to specific family resources—to build a scalable digital database.
Operational Role Mapping
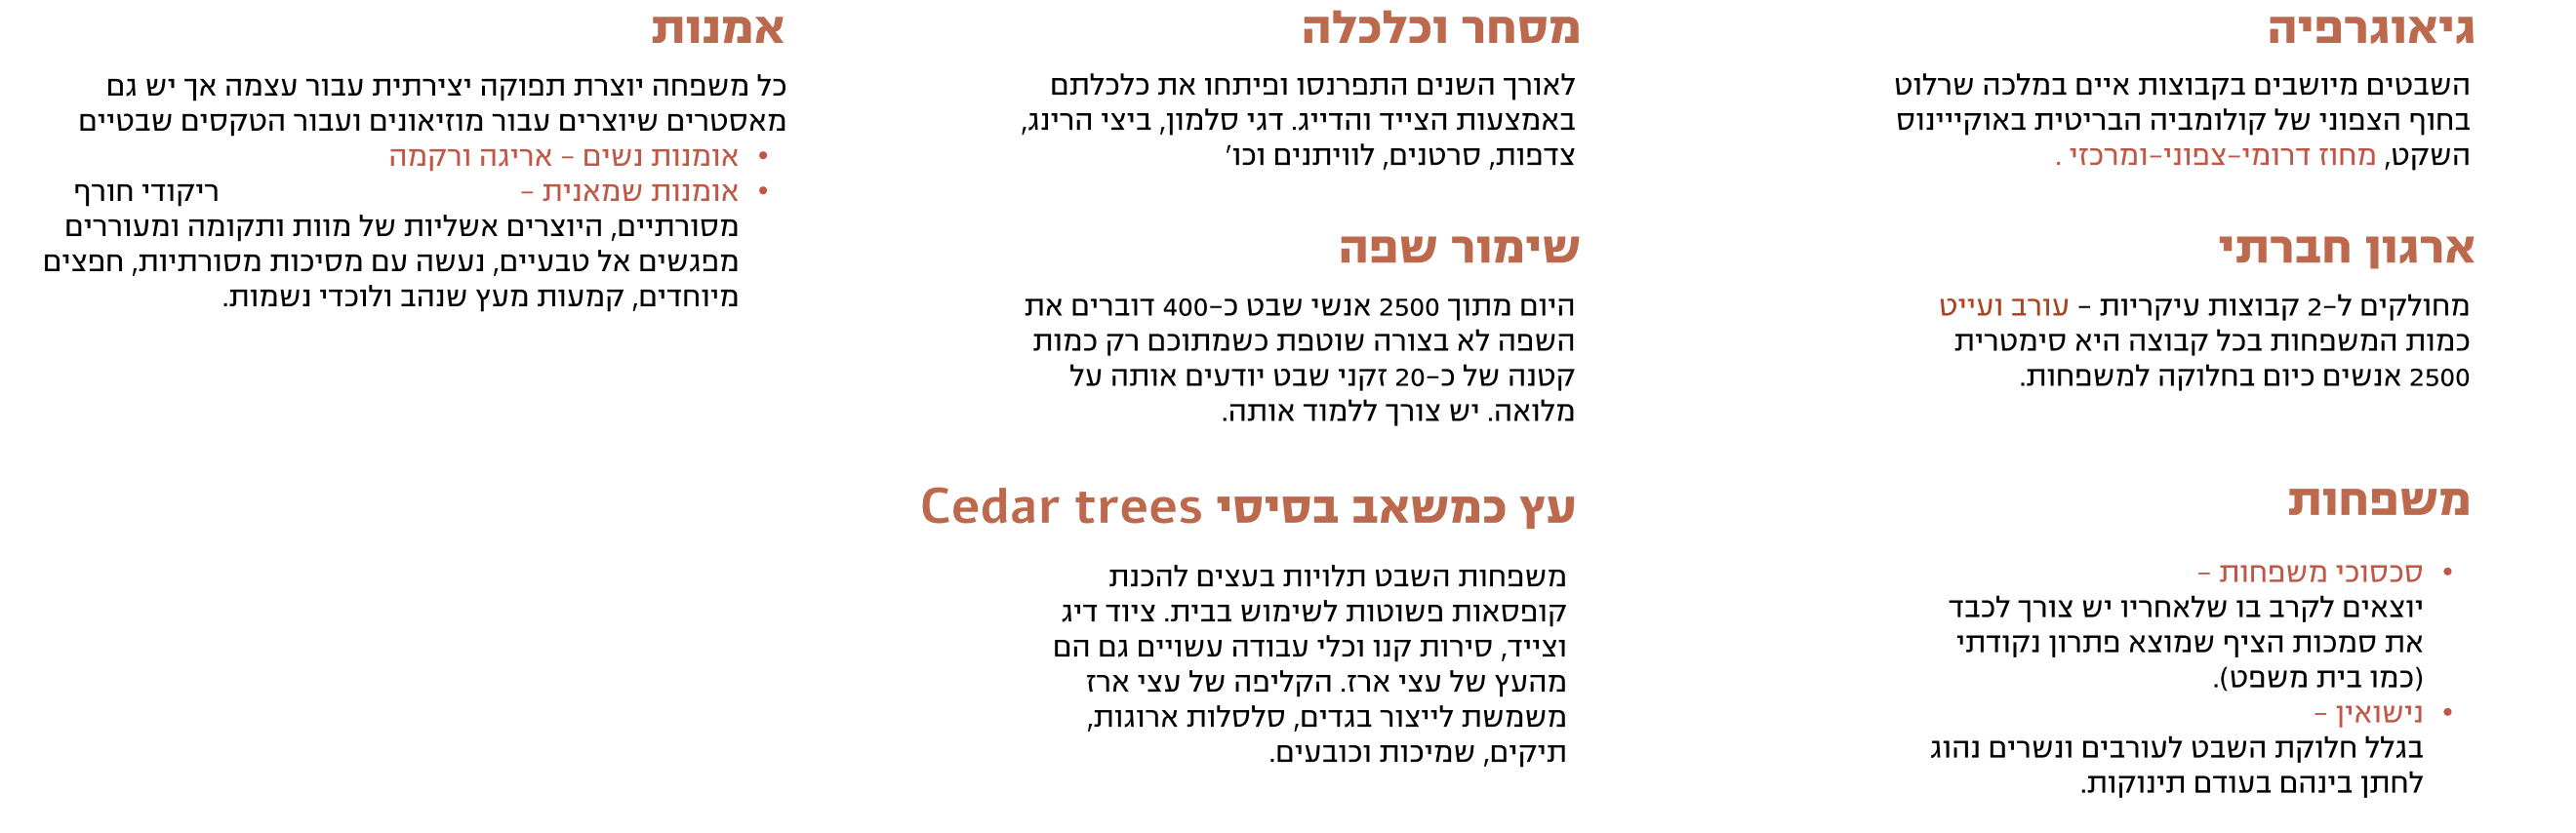
אמנות
כל משפחה יוצרת תפוקה יצירתית עבור עצמה אך יש גם מאסטרים שיוצרים עבור מוזיאונים ועבור הטקסים שבטיים
- אומנות נשים - אריגה ורקמה
- אומנות שמאנית - ריקודי חורף מסורתיים, היוצרים אשליות של מוות ותקומה ומעוררים מפגשים אל טבעיים, נעשה עם מסיכות מסורתיות, חפצים מיוחדים, קמעות מעץ שנהב ולוכדי נשמות.
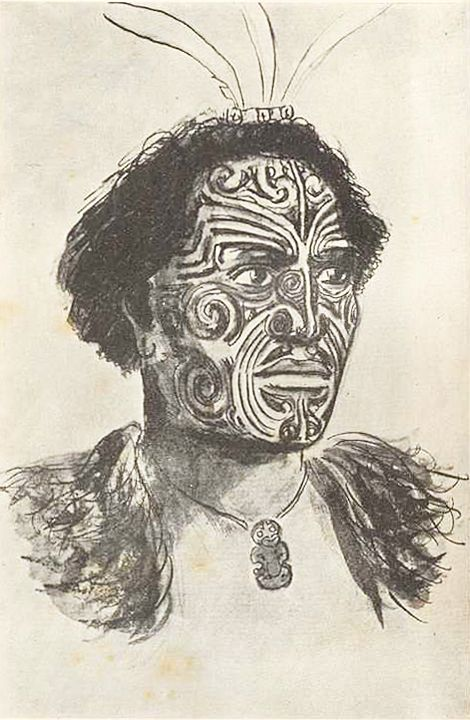
השבטים מיושבים בקבוצות איים במלכה שרלוט בחוף הצפוני של קולומביה הבריטית באוקייינוס השקט, מחוז דרומי-צפוני-ומרכזי .
מחולקים ל-2 קבוצות עיקריות - עורב ועייט
כמות המשפחות בכל קבוצה היא סימטרית
2500 אנשים כיום בחלוקה למשפחות.
- סכסוכי משפחות - יוצאים לקרב בו שלאחריו יש צורך לכבד את סמכות הציף שמוצא פתרון נקודתי (כמו בית משפט).
- נישואין - בגלל חלוקת השבט לעורבים ונשרים נהוג לחתן בינהם בעודם תינוקות.
גיאוגרפיה
ארגון חברתי
משפחות
לאורך השנים התפרנסו ופיתחו את כלכלתם באמצעות הצייד והדייג. דגי סלמון, ביצי הרינג, צדפות, סרטנים, לוויתנים וכו’
היום מתוך 2500 אנשי שבט כ-400 דוברים את השפה לא בצורה שוטפת כשמתוכם רק כמות קטנה של כ-20 זקני שבט יודעים אותה על מלואה. יש צורך ללמוד אותה.
משפחות השבט תלויות בעצים להכנת קופסאות פשוטות לשימוש בבית. ציוד דיג וצייד, סירות קנו וכלי עבודה עשויים גם הם מהעץ של עצי ארז. הקליפה של עצי ארז משמשת לייצור בגדים, סלסלות ארוגות, תיקים, שמיכות וכובעים.
מסחר וכלכלה
שימור שפה
עץ כמשאב בסיסי Cedar trees
Analyzing community occupations: from master artisans to maritime navigators—to define specific user tasks and system permissions. This ensured the interface supports the actual day-to-day needs of the tribe.
Interface Architecture
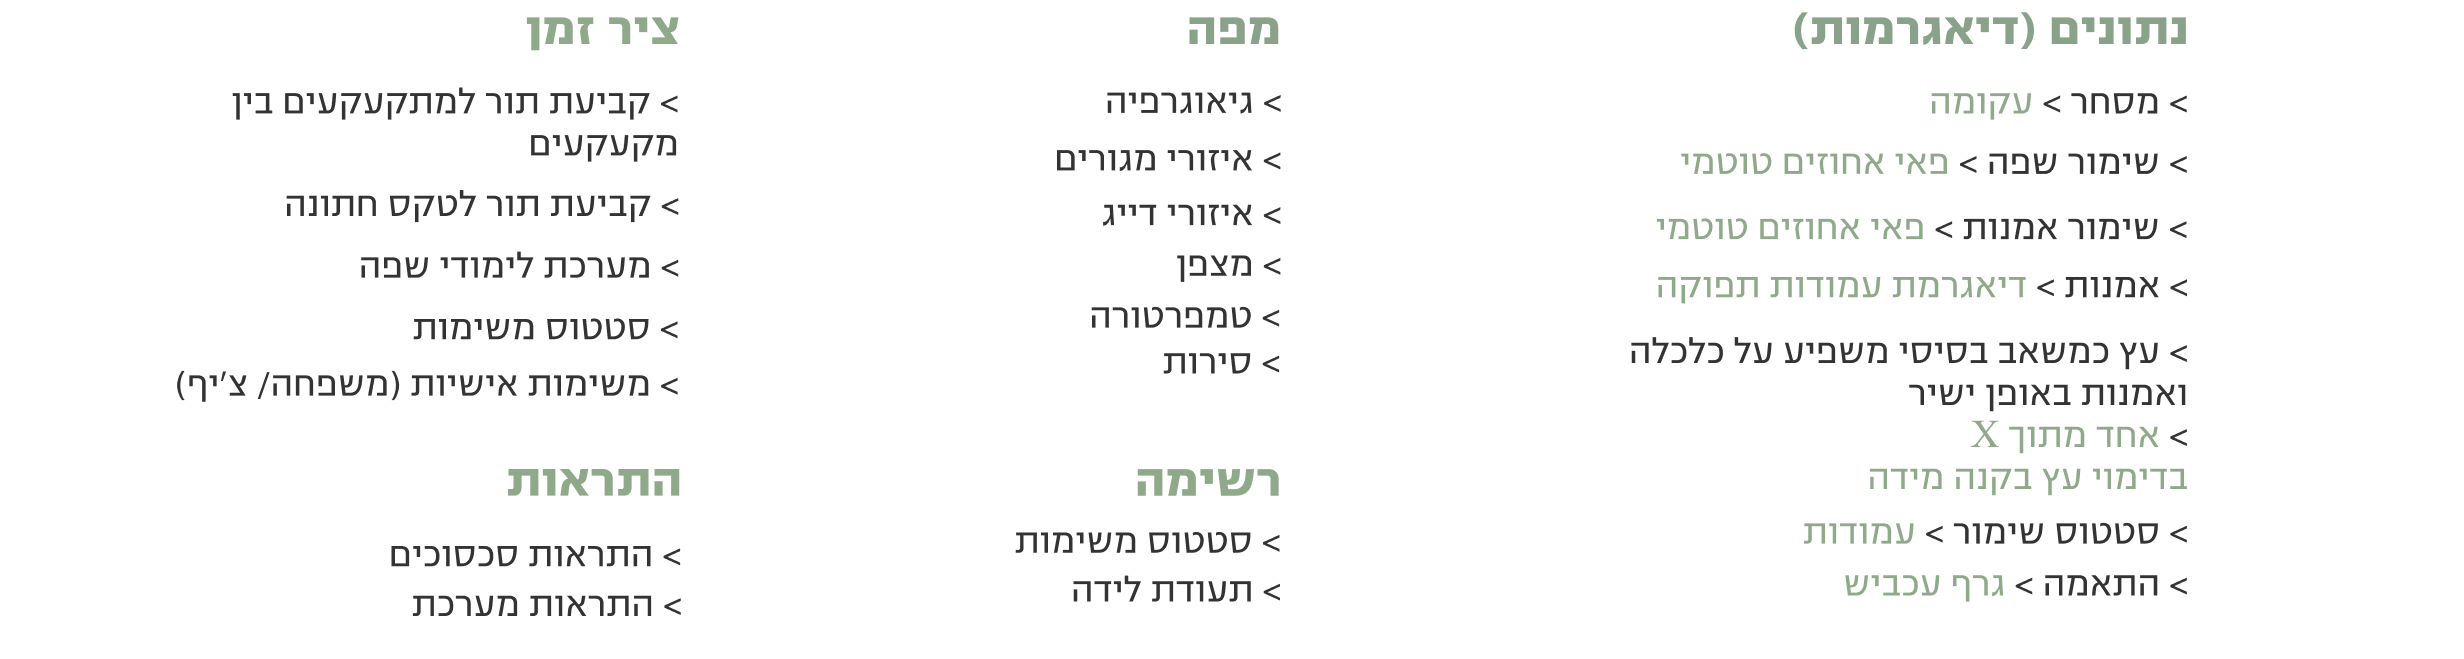
> גיאוגרפיה
מפה
נתונים (דיאגרמות)
רשימה
התראות
> מסחר > עקומה
> איזורי מגורים
> שימור שפה > פאי אחוזים טוטמי
> שימור אמנות > פאי אחוזים טוטמי
> אמנות > דיאגרמת עמודות תפוקה
> סטטוס שימור > עמודות
> התאמה > גרף עכביש
> עץ כמשאב בסיסי משפיע על כלכלה ואמנות באופן ישיר
> אחד מתוך X
בדימוי עץ בקנה מידה
> איזורי דייג
> מצפן
> טמפרטורה
> סירות
> סטטוס משימות
> תעודת לידה
> התראות סכסוכים
ציר זמן
> קביעת תור למתקעקעים בין מקעקעים
> קביעת תור לטקס חתונה
> מערכת לימודי שפה
> סטטוס משימות
> משימות אישיות (משפחה/ צ’יף)
> התראות מערכת
Translating the structural logic of the tribe into functional UI components. By mapping features like resource charts, marriage registries, and status alerts, we ensured the system remains intuitive despite its high data density.
Ideation & Sketching
Wireframes
Early sketches and low-fidelity wireframes used to iterate on the complex dashboard layout, focusing on data hierarchy and ease of use for tablet devices.
Matchmaking spider graph wireframe
Main map wireframe
Mood board
Cultural Visual Language
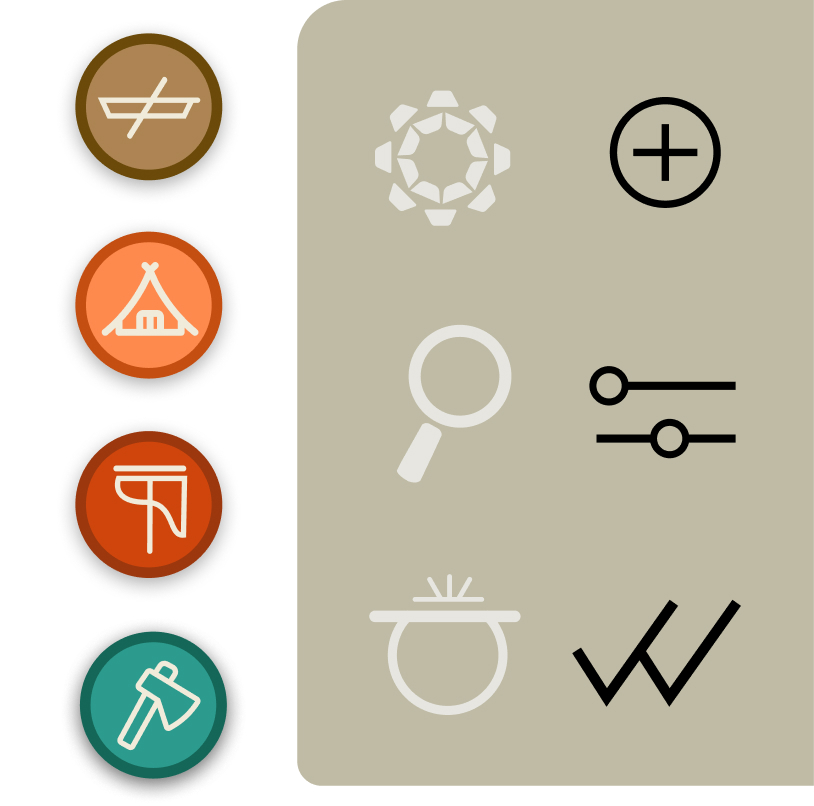
Iconography
To maintain cultural authenticity, I designed a custom set of 30+ icons and graphic motifs inspired by Haida art. These elements serve as the primary navigation system, ensuring the interface feels native to the tribe’s heritage.
Skills & Occupations
A comprehensive icon set representing the tribe's diverse professional paths, from naval warfare and fishing to ancestral arts and land cultivation.
Ancestral Totem Identity
Bespoke totem illustrations designed to distinguish the various family lineages, blending traditional tribal aesthetics with a modern, scalable digital style.
Interface & Cartography
Functional UI symbology and map markers developed to streamline navigation, enabling players to manage global actions and track strategic points of interest.
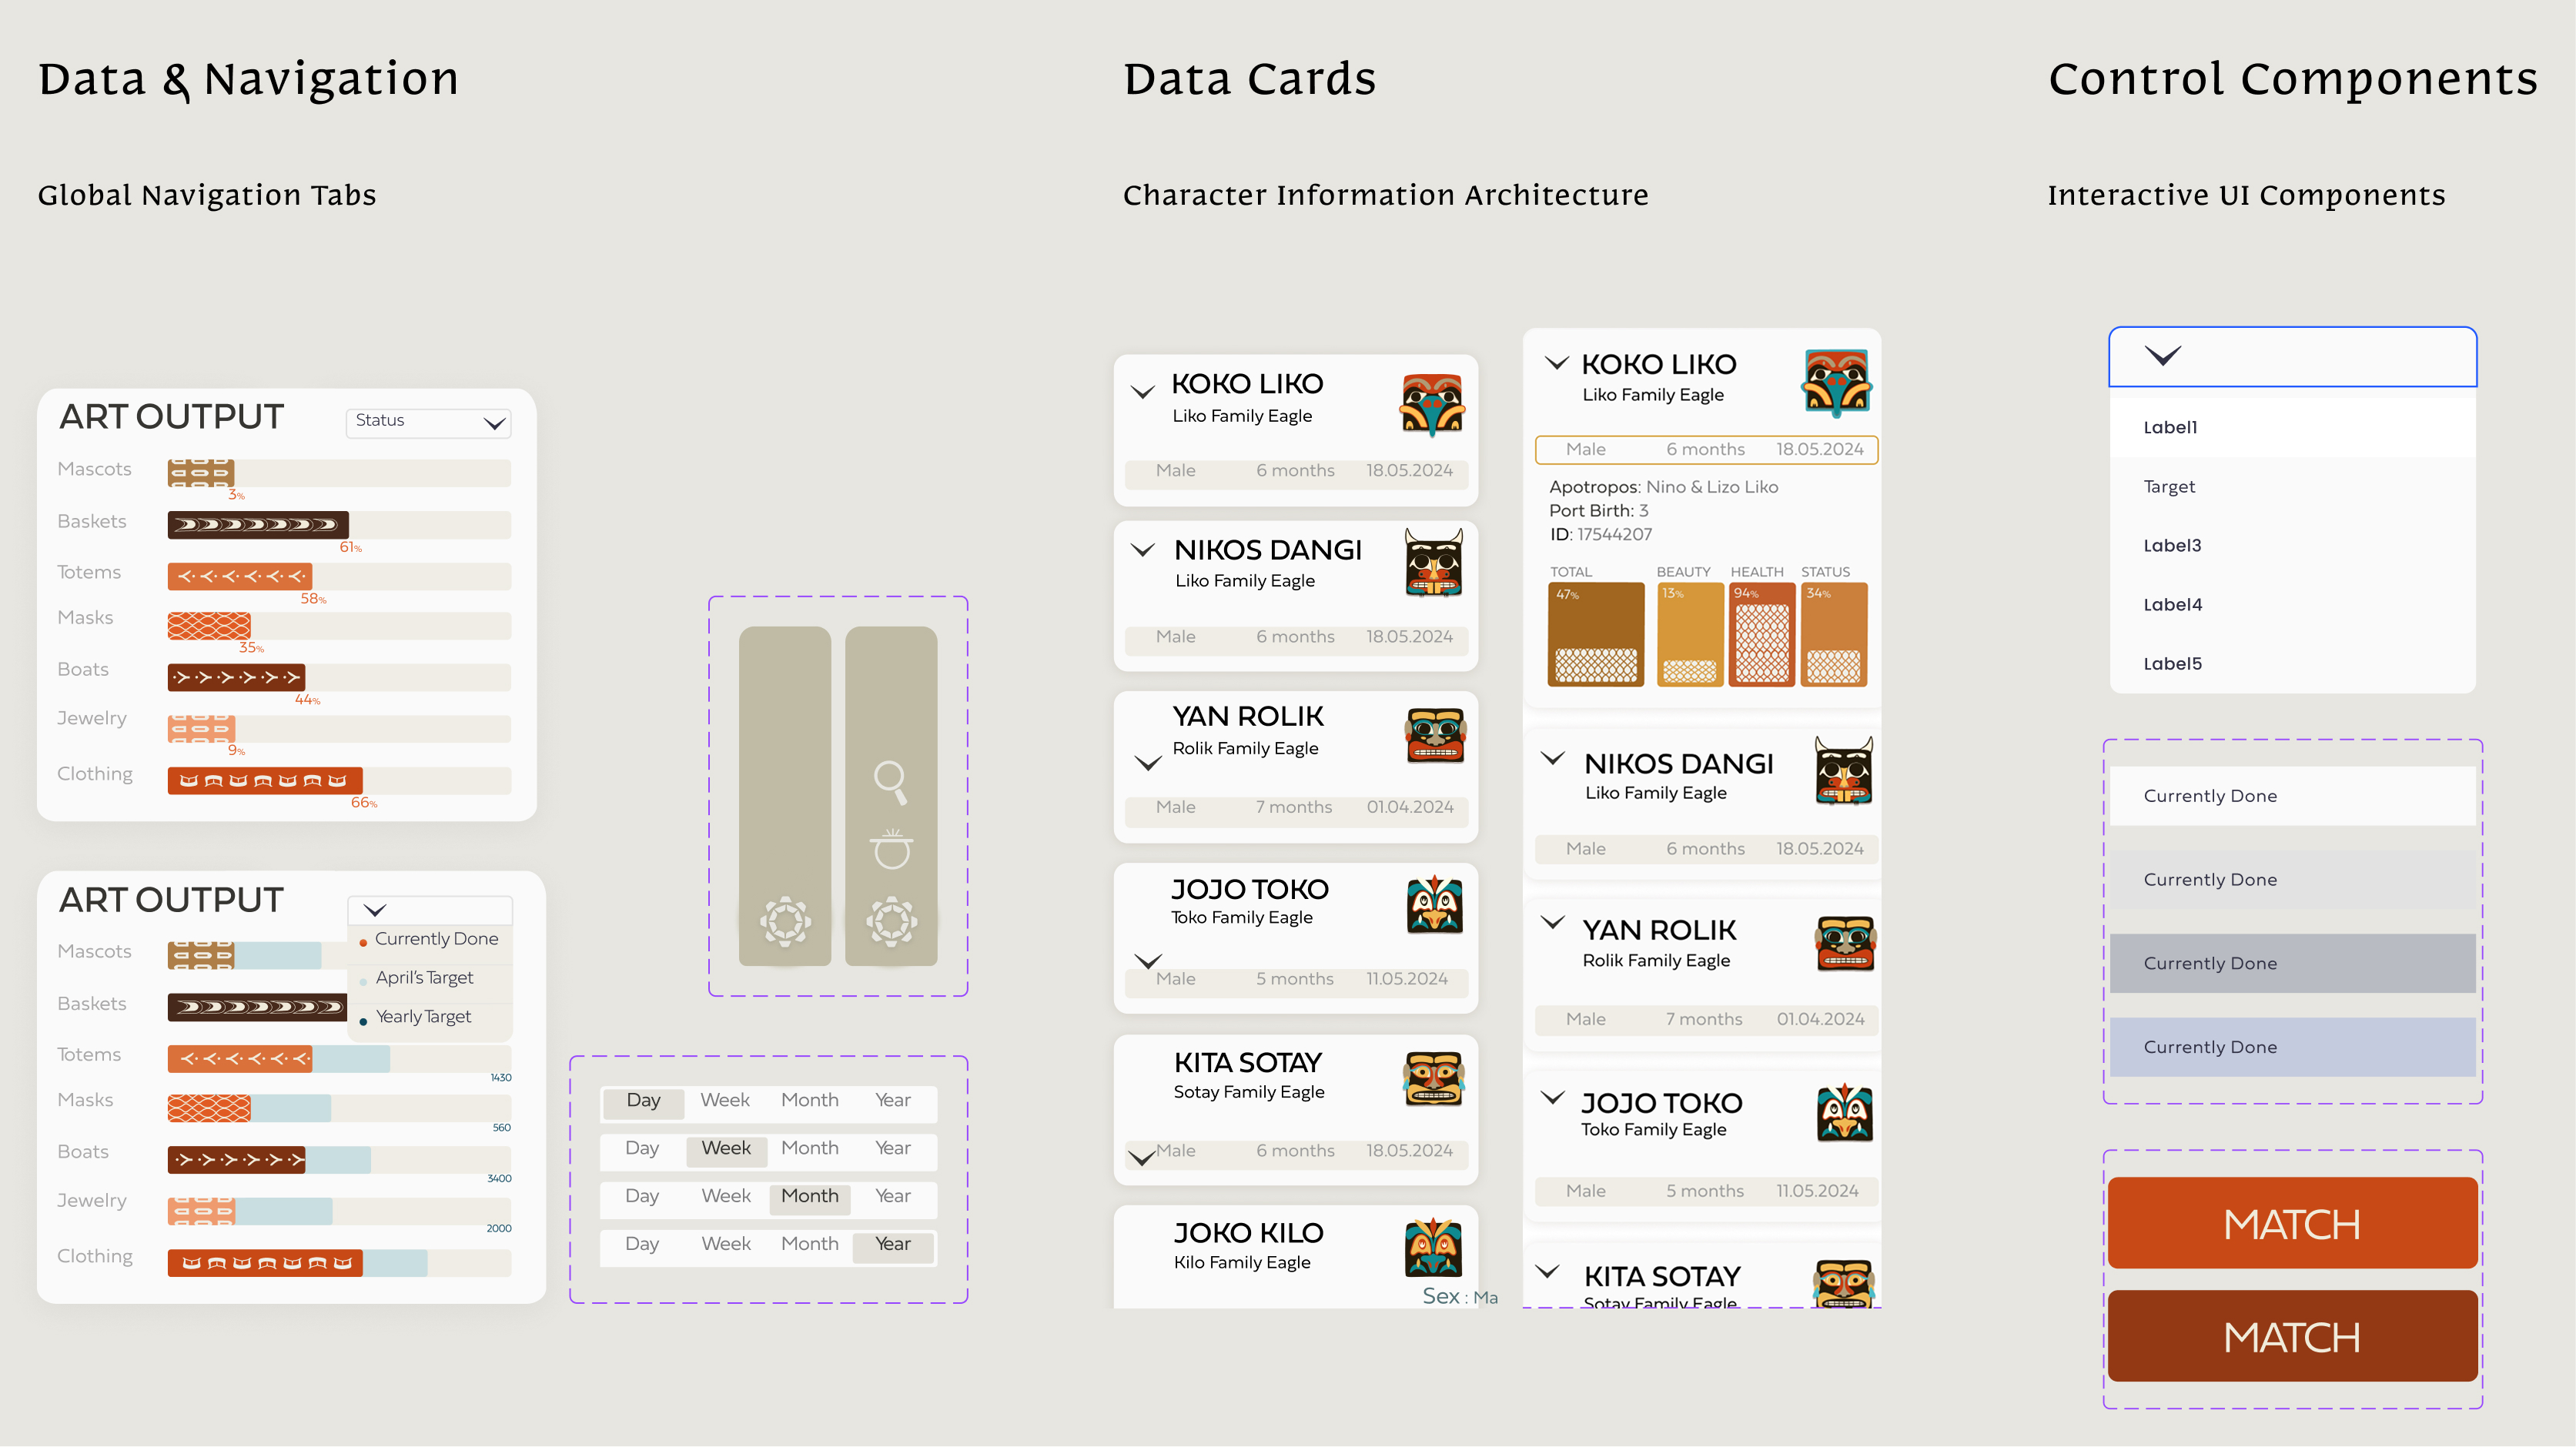
Design System & UI
A modular design system built to handle high-density data while maintaining a clean, accessible interface.
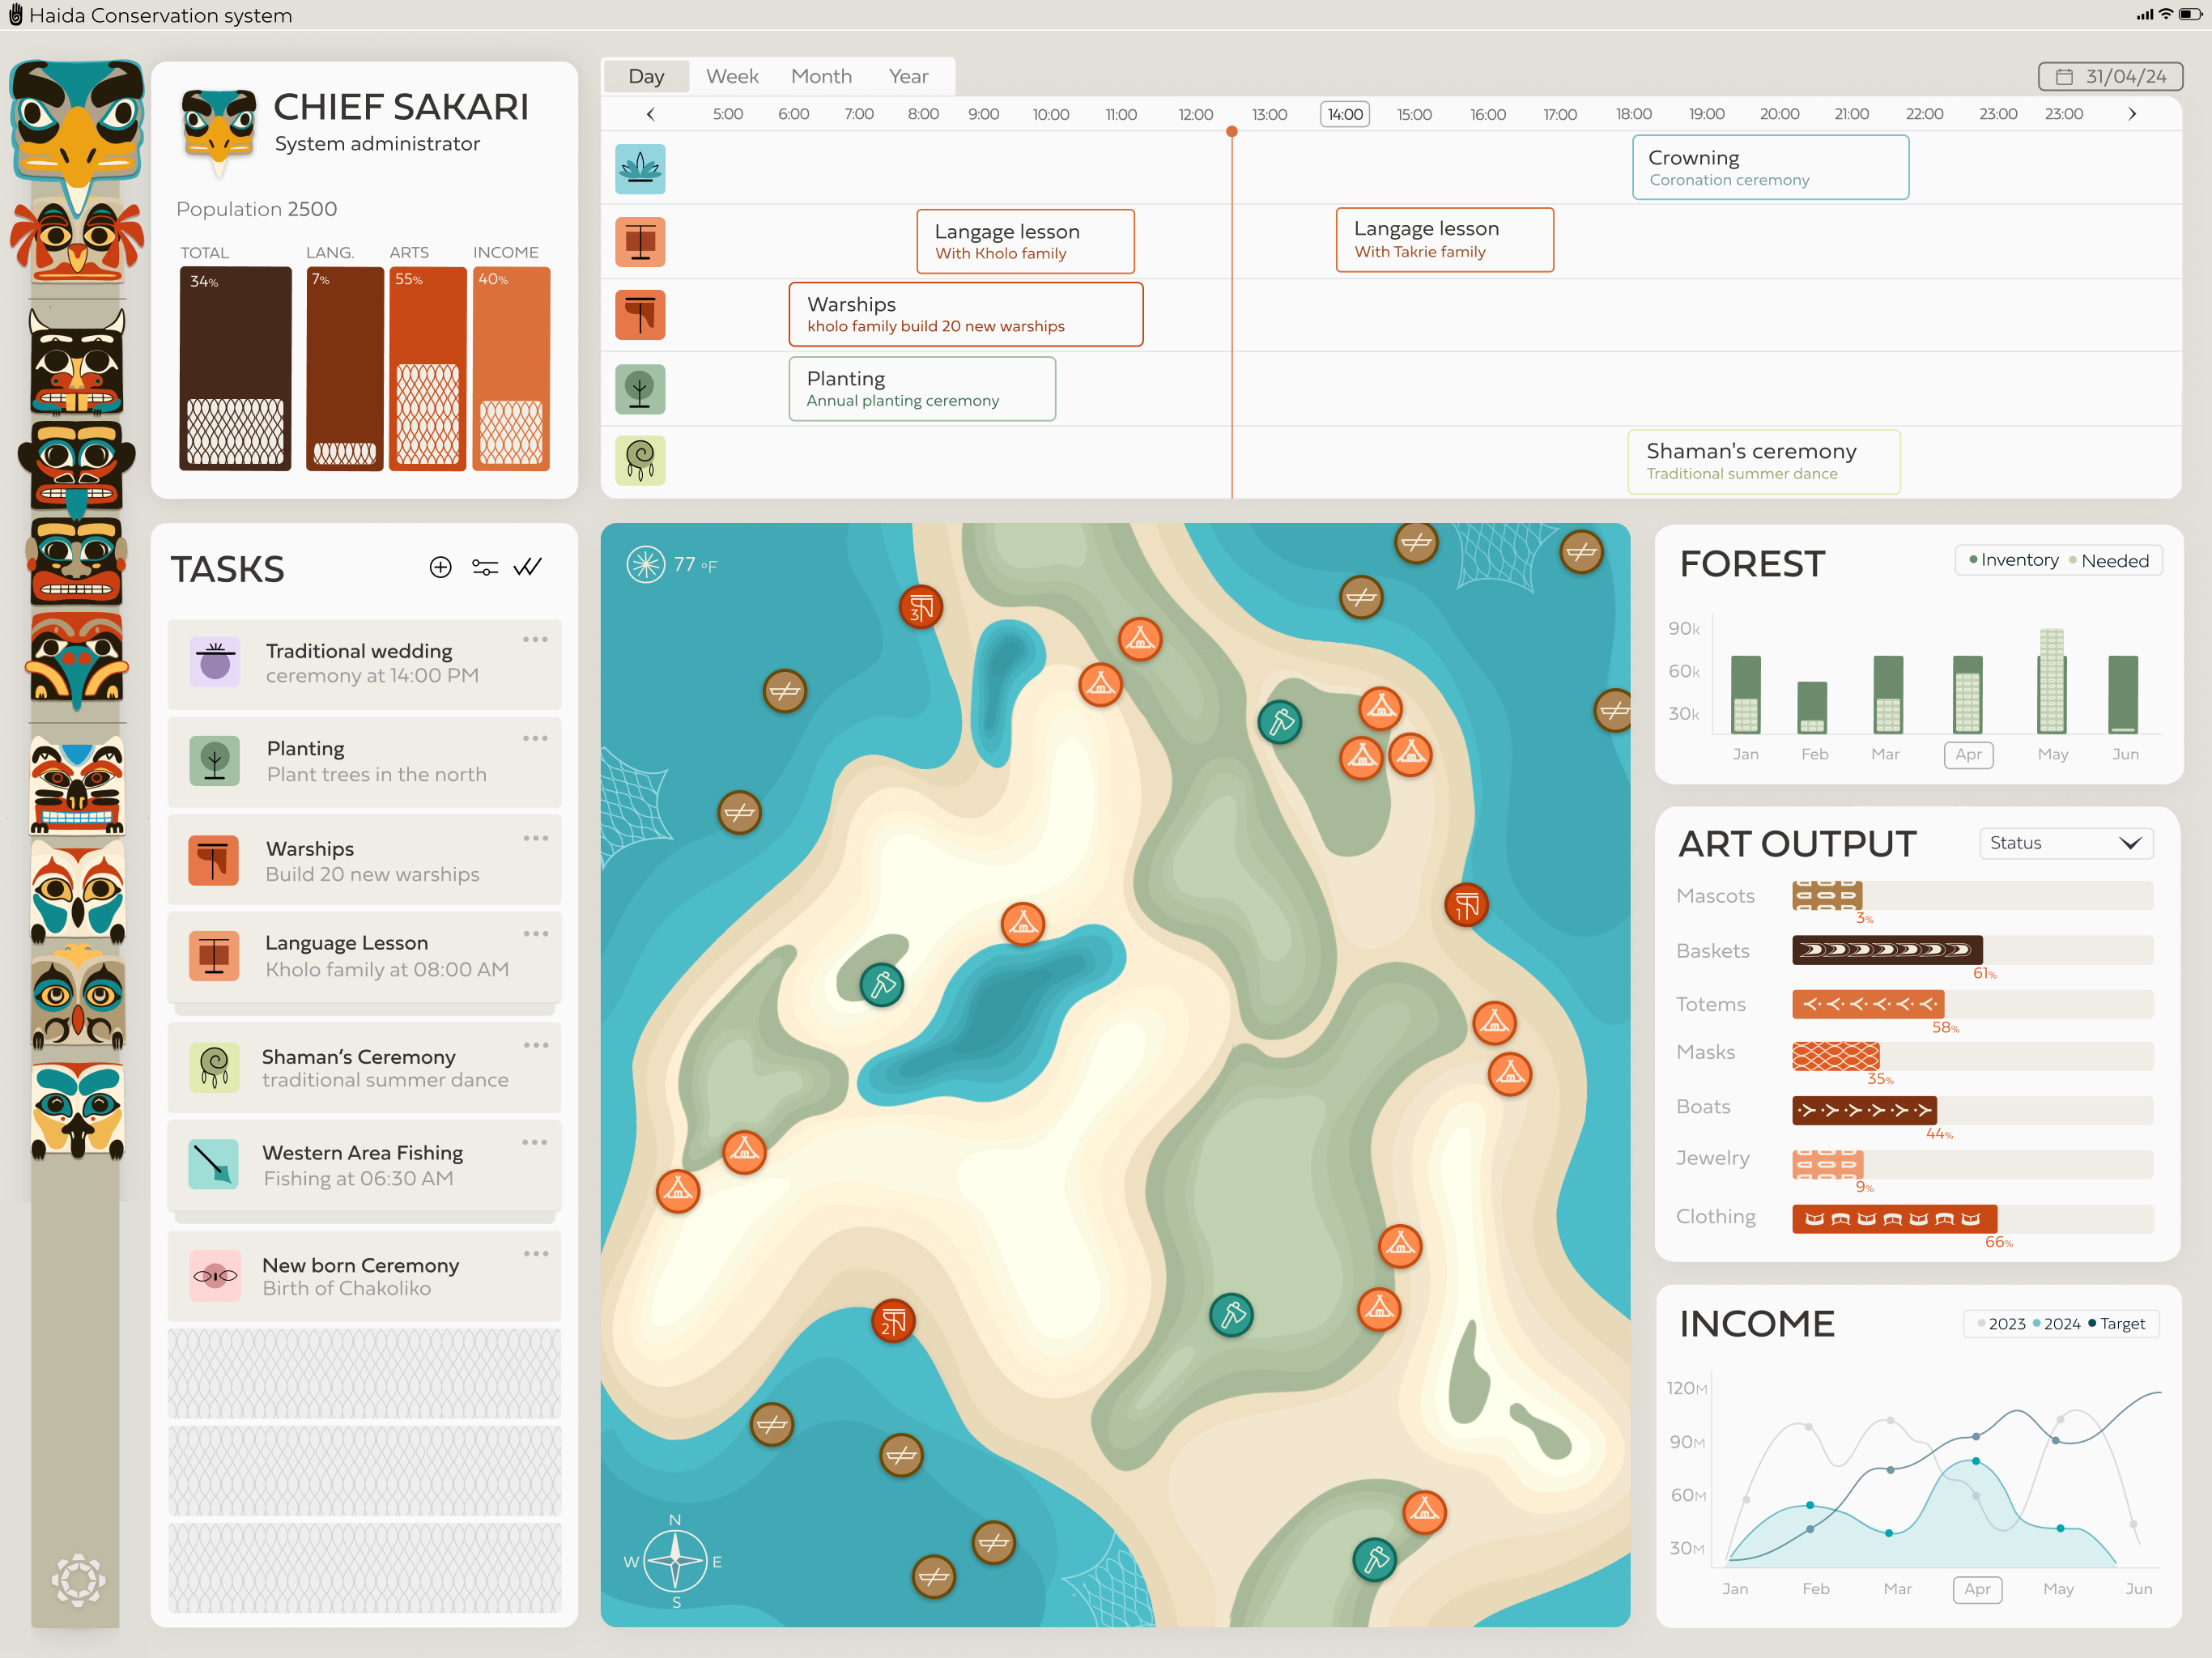
The Final UI
These interfaces allow both tribal leaders and families to monitor cultural preservation, manage resources, and track ancestral lineages in real-time, ensuring the tribe's legacy thrives in the digital age.
Leadership Command Center
The first line of communication: a lighthearted, digital nudge sent directly to their chat for an instant, humorous reminder.
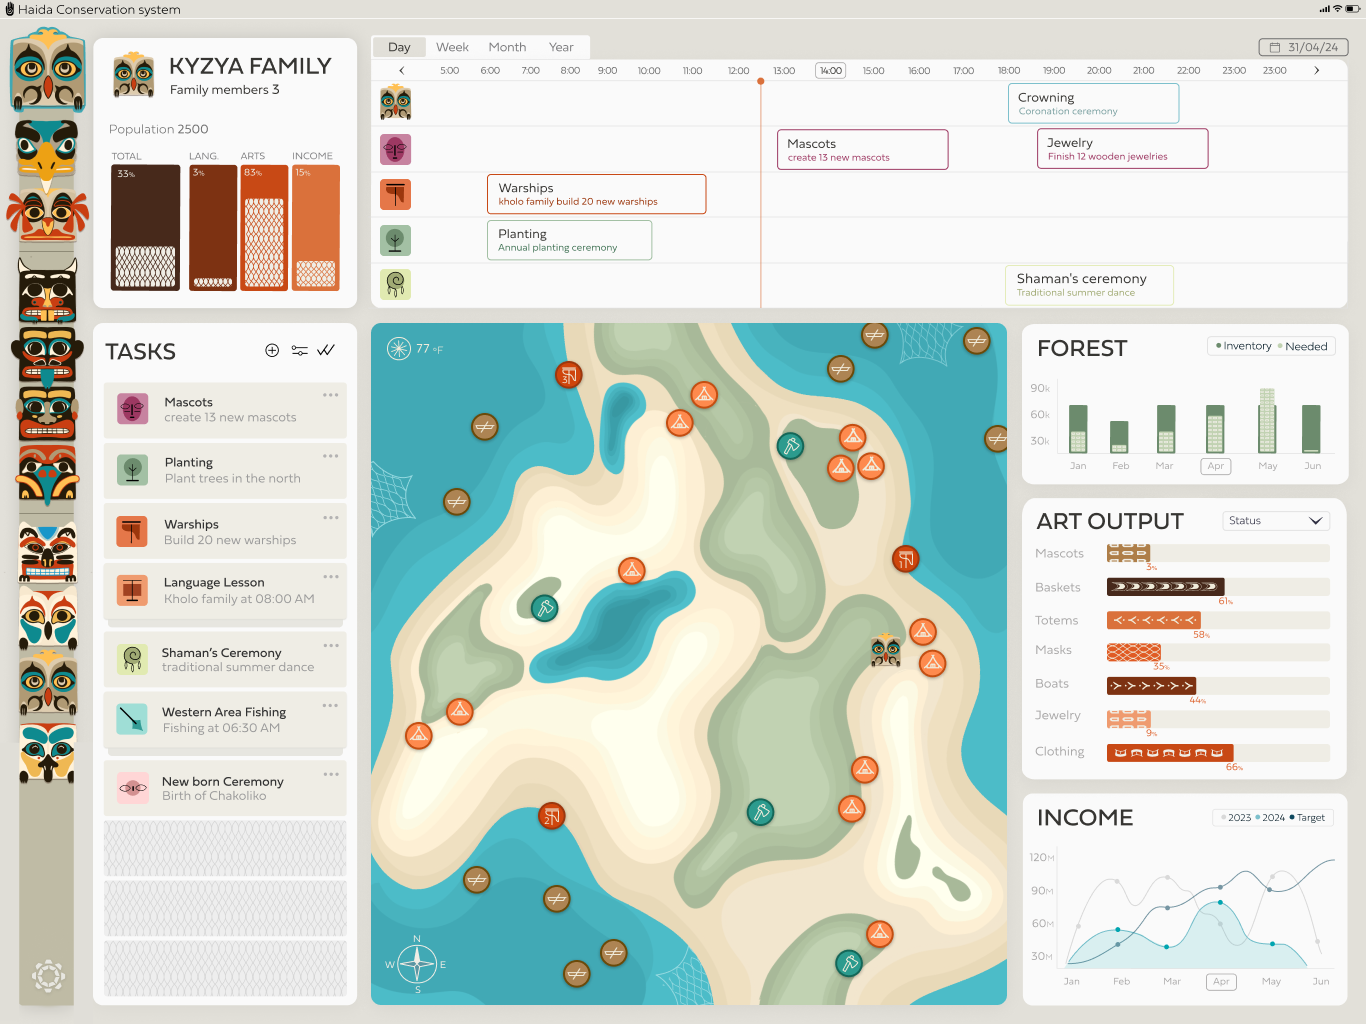
Family Dashboard
A localized view for families to manage daily tasks and territory. This dashboard acts as a gateway to the Dynasty Index, emphasizing how individual family growth contributes to the tribe’s collective future and social continuity.
Ancestral Matchmaking
Tribal Dashboard (Admin)
The heart of the system. Using a specialized spider chart, this interface compares candidates based on lineage skills and moiety laws. It facilitates strategic connections essential for maintaining the tribe's social fabric.
ronniebenhaim@gmail.com
0542336061
Designed & built by me
Tel-Aviv, Israel